You’ve installed your AI assistant. It’s answering questions and chatting with visitors. But here’s the real question: is it actually working?
Having a chatbot on your website is no longer enough. To drive real value—more leads, better engagement, and higher conversions—you need to measure what happens inside those conversations.
NoForm AI’s built-in chatbot analytics dashboard provides a 360-degree view of your assistant’s performance across visitors, chats, and captured leads.
This guide covers how to navigate the Insights dashboard, interpret key metrics (Visitors, Chats, Leads), manage captured leads, and use conversation history to optimize your bot and maximize ROI.
What is chatbot analytics?
Chatbot analytics is the process of measuring and analyzing the interactions between your AI assistant and your website visitors.
It answers critical questions like:
- How many people are seeing my chatbot?
- What percentage of visitors actually engage with it?
- Which conversations result in qualified leads?
- Where is my chatbot struggling to answer questions?
The purpose isn’t just to collect numbers—it’s to gain actionable insights that help you improve engagement, qualify more leads, and ultimately drive more revenue.
Key metrics that matter for real business outcomes
While traditional web analytics might tell you how many people visited a page, chatbot analytics tells you what they did there—what questions they asked, if they stayed engaged, and if they completed a goal.
For example, Google Analytics might show you that 500 people visited your pricing page. NoForm’s chatbot analytics shows you that 50 of them engaged with your assistant, 10 asked about refund policies, and 5 provided their email to get a custom quote. That’s the difference.
Key metrics that matter for real business outcomes include:
- Engagement: Are people noticing and opening the chat widget?
- Qualification: Is the bot successfully gathering information?
- Conversion: Are conversations turning into qualified leads?
Analytics are essential because AI isn’t “set it and forget it.” By reviewing this data, you can improve your AI’s behavior, refine its content, and optimize lead-generation flows.
Overview of NoForm AI’s analytics dashboard
NoForm AI organizes your data into three primary tabs located in the sidebar of your dashboard:
- Insights tab: Your high-level performance command center—KPIs, conversion rates, geographic data, and trend visualization.
- Chats tab: A complete archive of every conversation, with filters to find specific chats and learn from visitor interactions.
- Leads tab: A focused view of qualified leads captured by your assistant, complete with contact info and conversation context.
The system uses real-time processing to ensure that as soon as a visitor interacts with your assistant or submits their details, the data is reflected in your dashboard.
This means you can check your dashboard at any time and see up-to-the-minute performance. Your sales team can follow up on fresh leads within minutes, not hours or days.
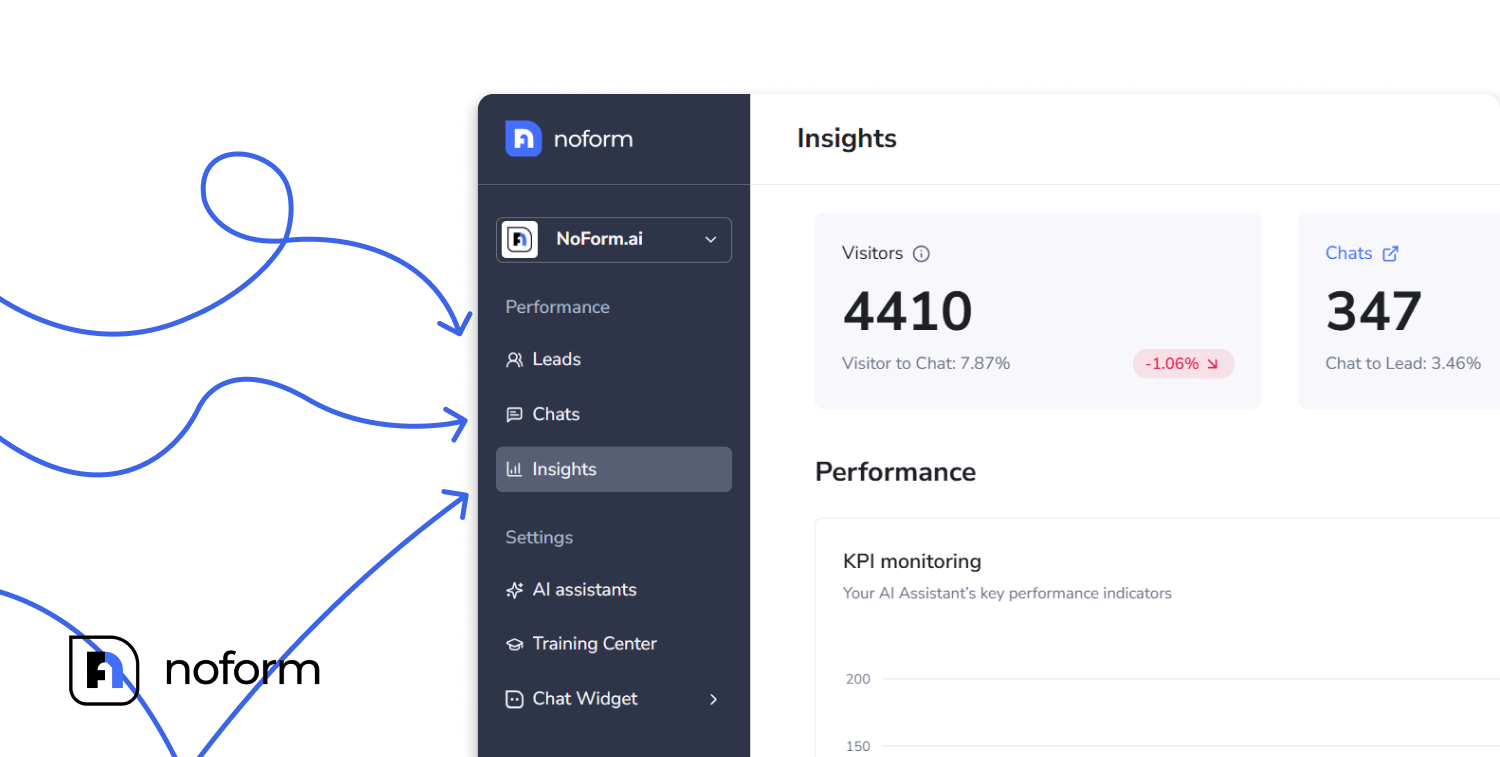
The Insights tab: Your performance command center
The Insights tab is your primary hub for data. It provides a visual timeline of your performance and a detailed breakdown of your metrics.
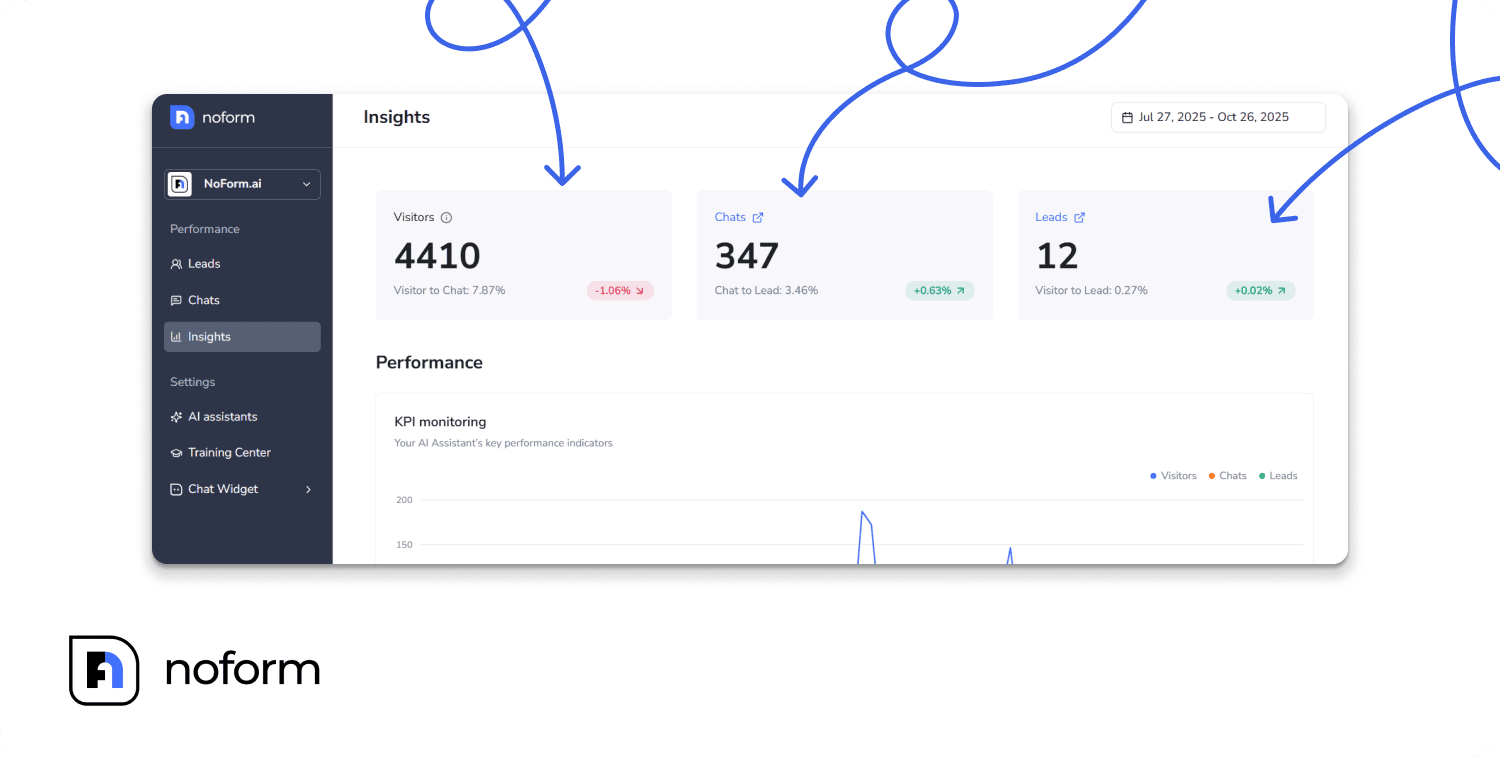
The three core metrics that define success
Think of your chatbot analytics as a funnel with three stages:
1. Visitors
This is the total number of people who visited pages where your AI Assistant is active. It represents your potential audience—the pool of visitors who could engage with your bot.
If your visitor count is low, you might need to add the chatbot to more pages or drive more traffic to pages where it’s already installed. If it’s high but engagement is low, you have a visibility or messaging problem.
2. Chats
This is the number of visitors who actually interacted with your assistant—they opened the chat bubble and sent at least one message.
This metric measures engagement. A healthy chat rate means your welcome message is compelling, your chat bubble is visible, and visitors see value in talking to your assistant. Low chat rates signal that something about your bot’s presentation needs work.
3. Leads
These are users who provided contact information—specifically, an email address and/or phone number—during their conversation with your assistant.
This is your bottom-line metric. Leads are qualified prospects who’ve expressed interest in your product or service. The more leads you capture, the more opportunities your sales team has to close deals.
Understanding conversion rates
Raw numbers are useful, but conversion rates tell the real story of efficiency:
Visitor to Chat
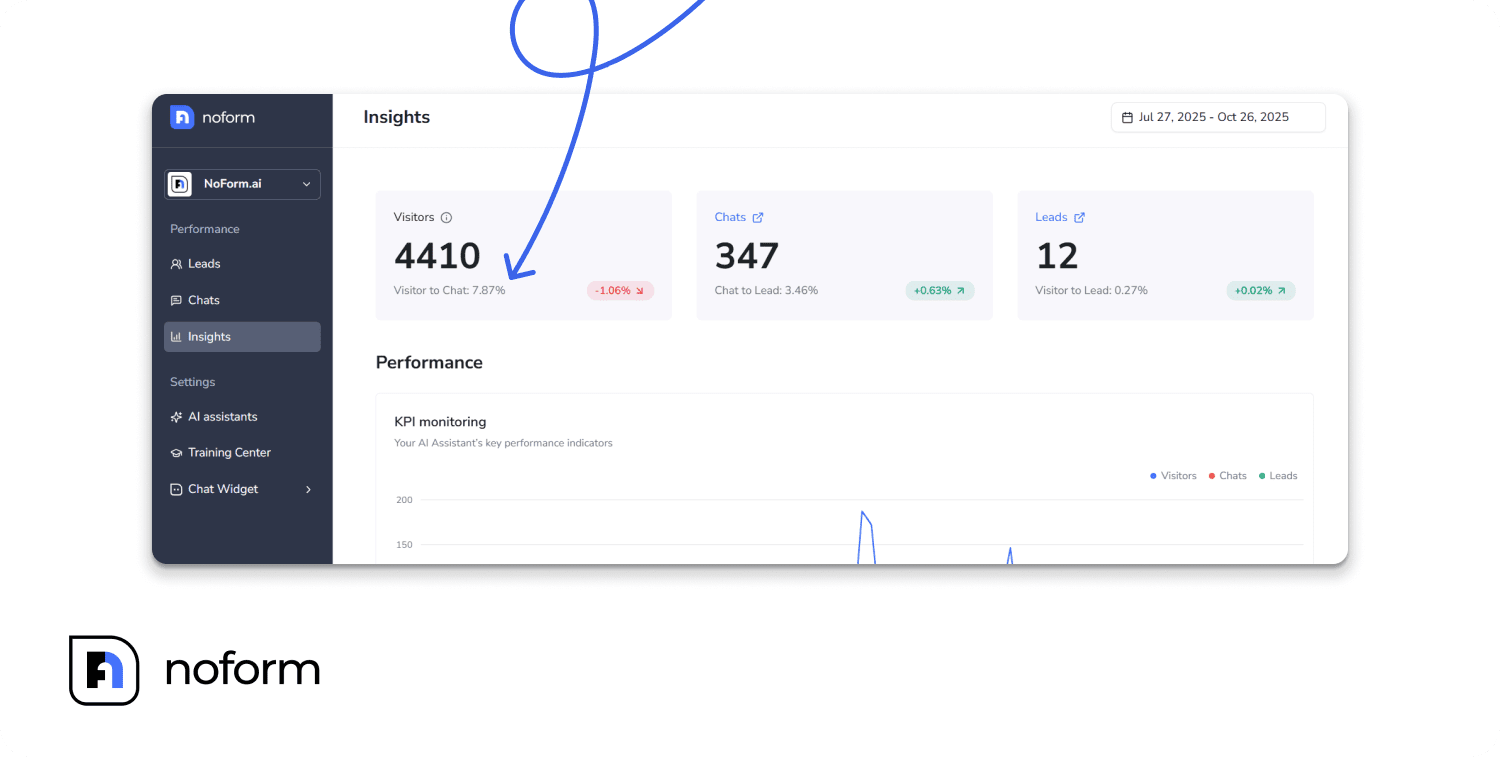
This shows you the percentage of visitors who engage with your assistant. For example, if you had 1,000 visitors and 100 chats, your Visitor to Chat rate is 10%.
What “good” looks like: Industry benchmarks vary, but a rate between 5% and 15% is typical. Anything above 15% is excellent and suggests your chatbot is highly visible and appealing.
If your rate is low (under 5%), it usually means:
- Your chat bubble isn’t visible enough
- Your welcome message might not be catchy enough
- The bot appears on pages where visitors aren’t ready to engage
Chat to Lead
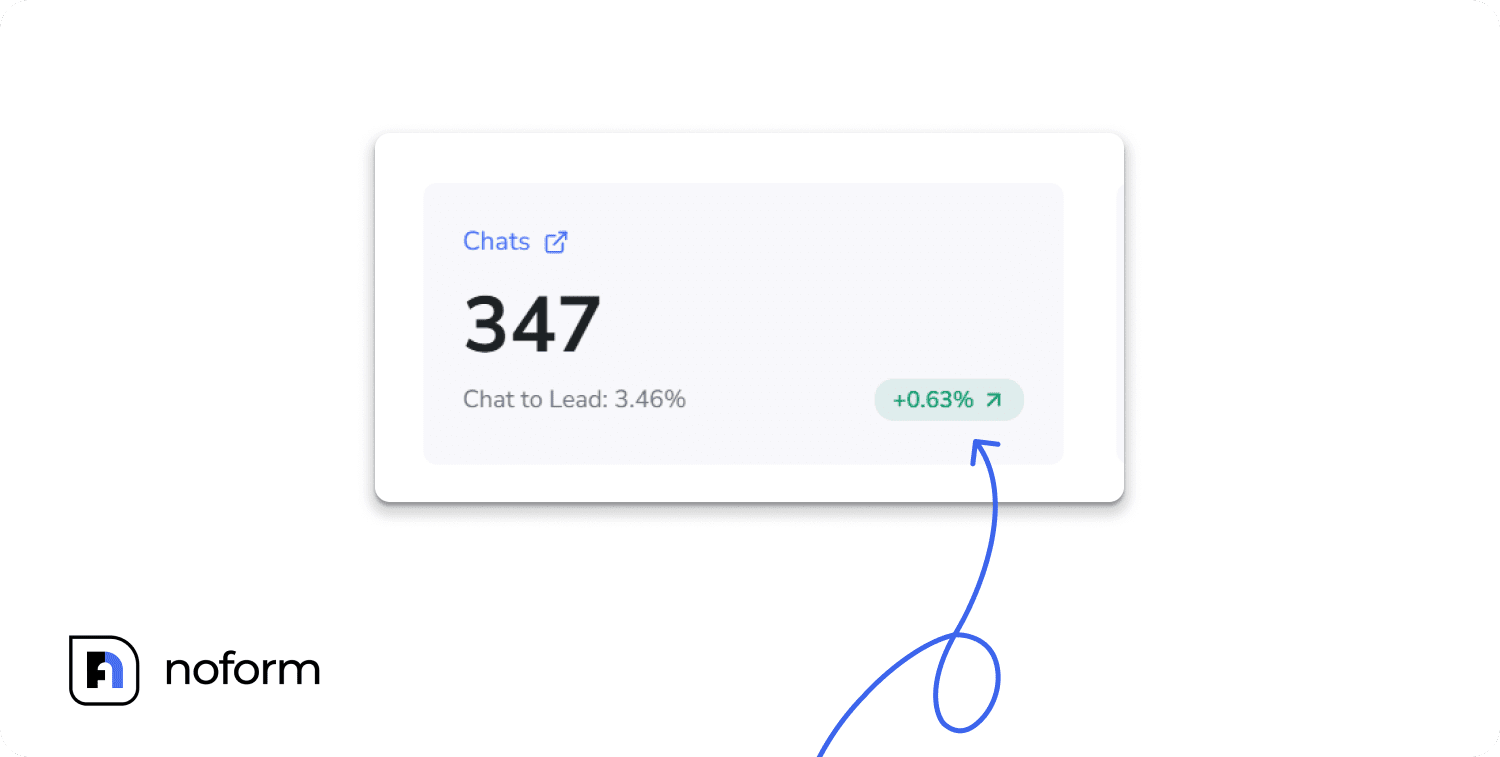
This measures how many conversations result in qualified leads. If you had 100 chats and 5 leads, your Chat to Lead rate is 5%. It indicates how many chatters trusted the bot enough to give their details.
What “good” looks like: A rate between 3% and 10% is solid. Anything above 10% means your bot is exceptionally good at qualifying visitors.
If your rate is low (under 3%), it usually means:
- The bot asks for contact info too early or too abruptly
- Visitors don’t see enough value to share their information
- Your lead qualification flow has friction or confusion
Visitor to Lead
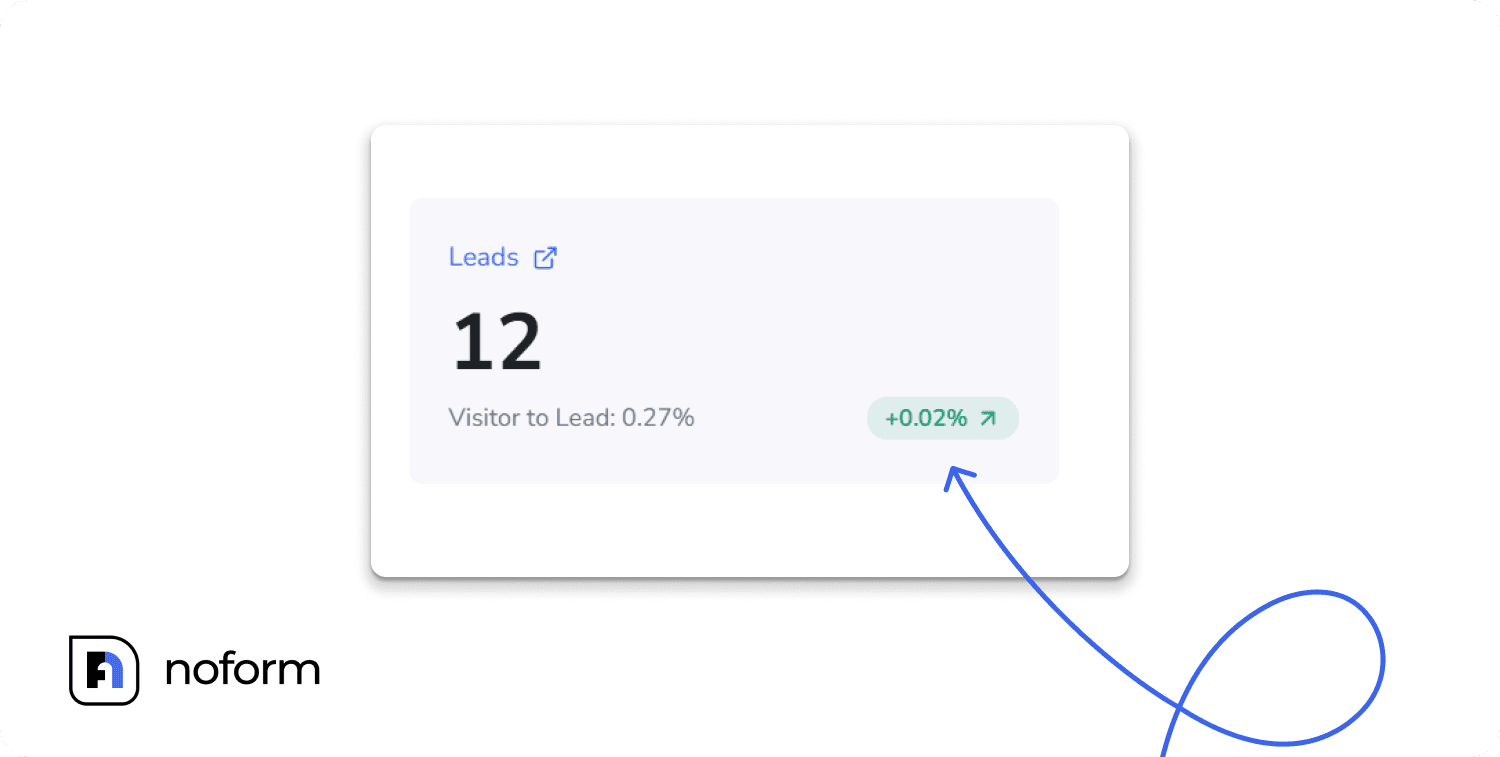
This is your ultimate success metric—the percentage of all visitors who become qualified leads. If you had 1,000 visitors and 5 leads, your Visitor to Lead rate is 0.5%.
What “good” looks like: Even a rate of 0.5% to 2% can be transformative for your business. If you’re getting 10,000 monthly visitors, a 1% conversion rate means 100 new leads every month.
Visualizing trends with the Performance chart
Below your core metrics, you’ll see a line graph that plots Visitors, Chats, and Leads over time. Unlike the static numbers at the top of the page, this visual timeline shows movement and momentum, helping you understand the “why” behind your data.
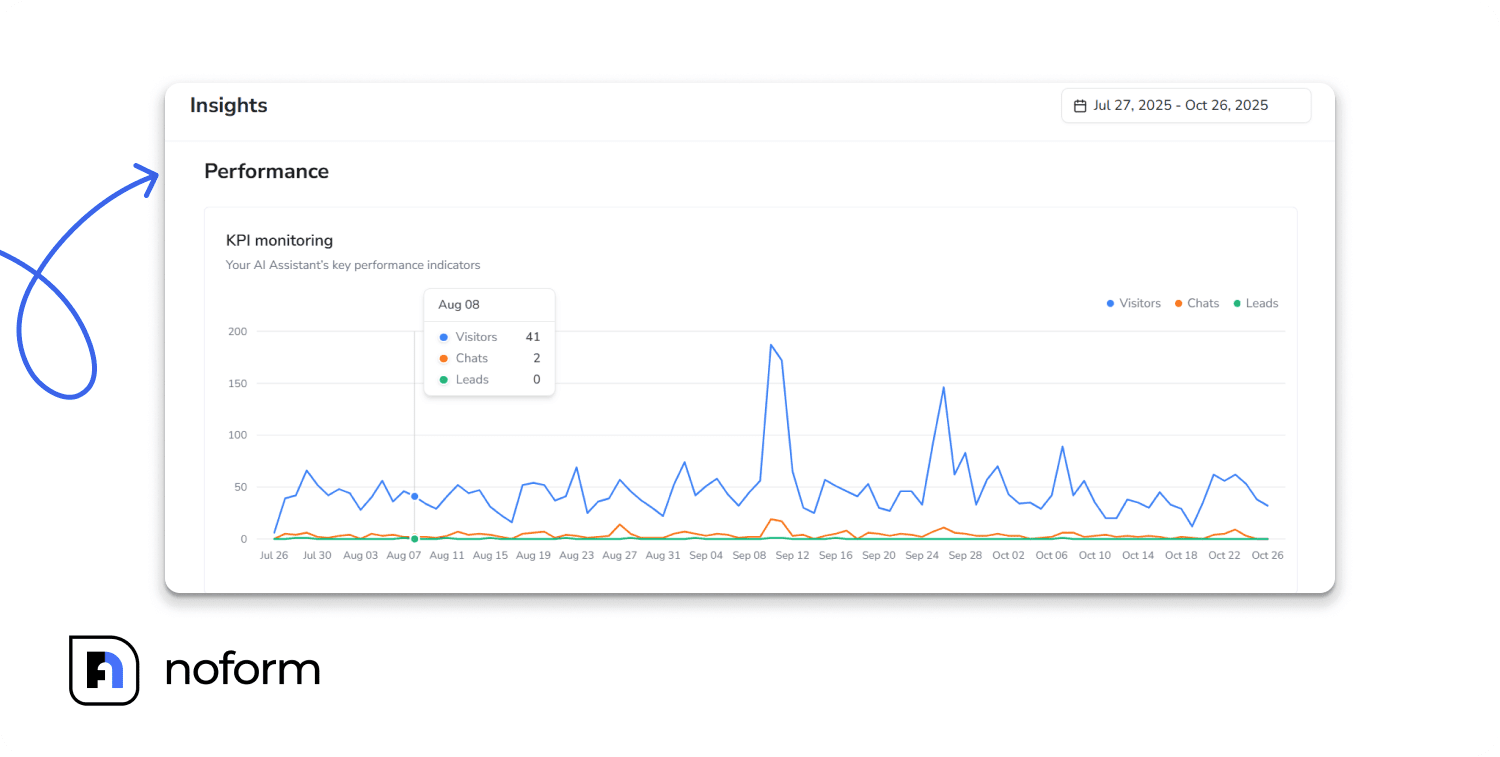
By hovering over any point on the graph, you can see the exact numbers for that specific day. This visual timeline helps you spot:
- Spikes: Days or weeks with unusually high activity (often tied to marketing campaigns or product launches)
- Drops: Sudden decreases that might indicate technical issues or seasonal slowdowns
- Trends: Gradual increases or decreases that reveal long-term patterns
What each metric tells you
The real value of the performance graph comes from analyzing the relationships between the three metrics.
Visitors trending up, but chats flat: You have an engagement problem. More people see your bot, but they aren’t starting conversations. This could mean the chat bubble is in a less visible spot, or the welcome message might be too generic. Create page-specific assistants with tailored messaging or adjust your welcome message to be more contextual.
Chats high, but leads low: You have a qualification problem. Visitors are interacting with your assistant, but don’t share their contact info. This may happen if you ask for email/phone too soon, or the value proposition isn’t clear before requesting details. Check your chat history to see where people leave, and try answering their questions before asking for their details.
All metrics declining: This suggests technical issues or an overall drop in site traffic. Check that the chatbot widget is loading correctly, review recent site updates, and consider seasonal traffic trends or increased competition.
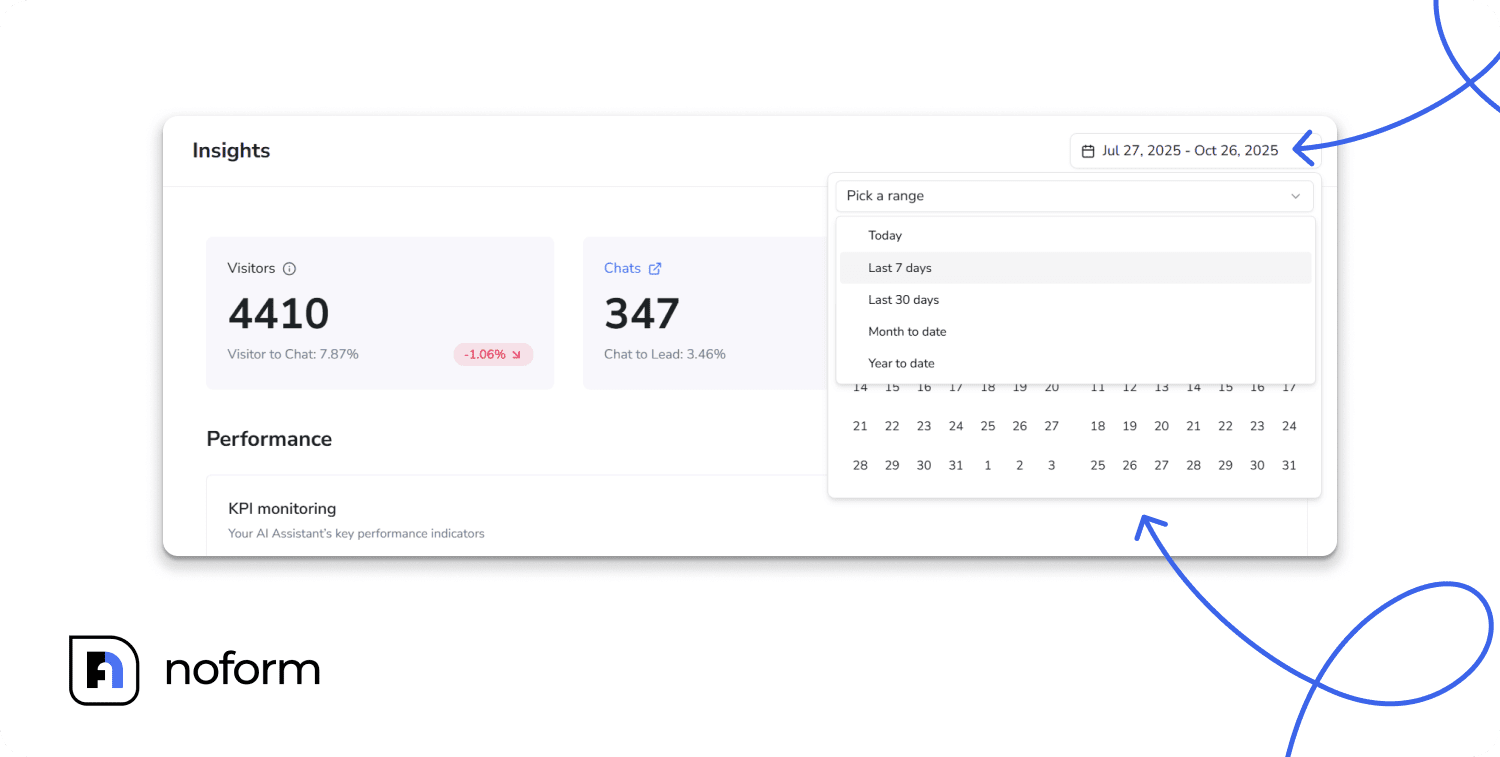
Using date ranges strategically
The date range selector allows you to focus your analysis on specific periods. Using this tool strategically can help you validate your optimization efforts:
- Week-over-week comparison: Select the last 7 days and compare them to the previous 7 days. This helps you spot immediate impacts from recent changes.
- Monthly trend analysis: Look at full months to smooth out weekly fluctuations. This view is ideal for quarterly reviews and spotting bigger patterns.
- Before/after comparisons: If you updated your welcome message or training data on a specific date (e.g., March 15th), set your date range to March 1–14 and then March 15–28. This allows you to measure the exact impact of those changes.
- Identifying best-performing periods: Use date ranges to isolate your highest-performing weeks. Analyze what was different during those periods—such as a specific ad campaign or content update—and try to replicate those conditions.
Geographic breakdown: Know where your audience is
The Countries table in the Insights tab is a powerful tool for understanding your global reach.
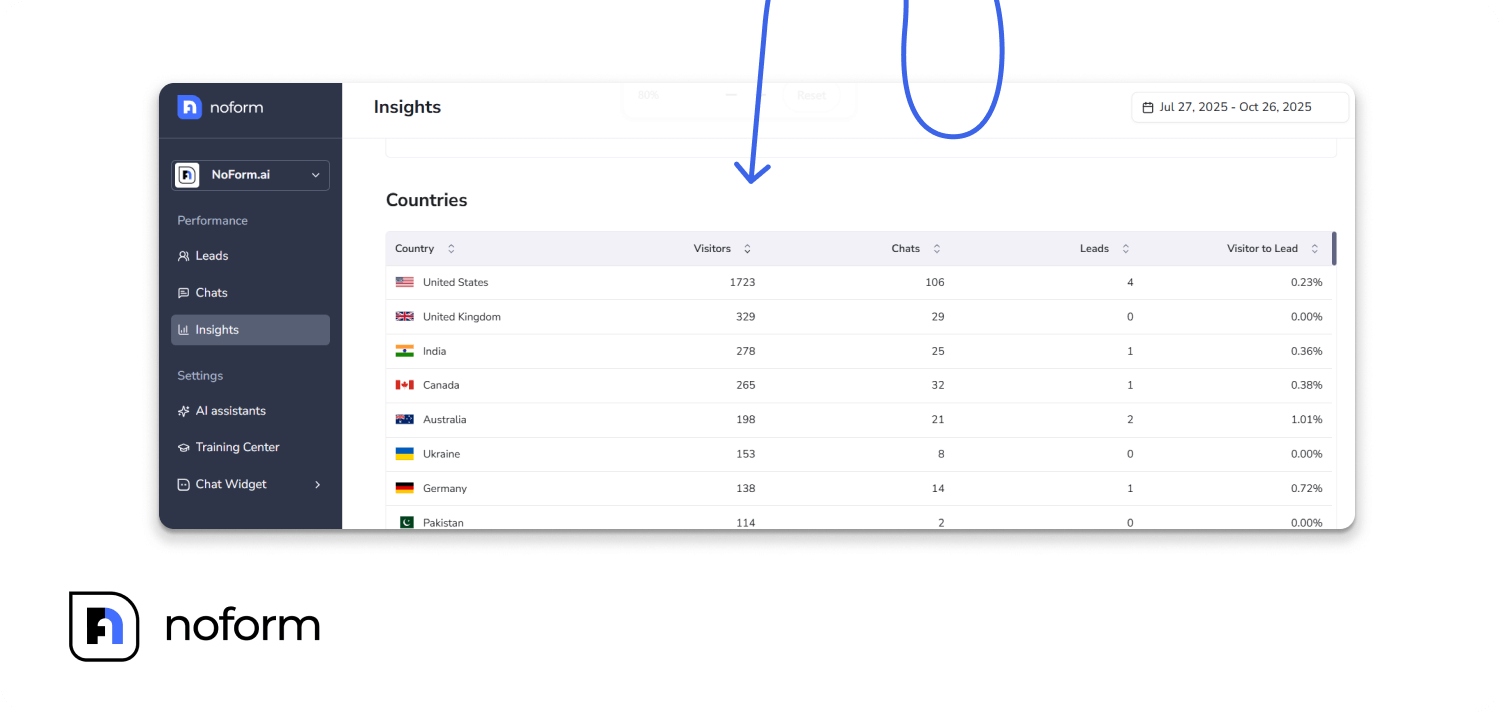
For every country, NoForm AI breaks down: Visitors, Chats, Leads, and Visitor to Lead % (the conversion rate for that specific country).
Geographic insights from the data
By analyzing this table, you can identify untapped markets. When you see consistent traffic from non-English-speaking countries, that’s a clear signal to add multilingual support.
If a country shows high traffic but low engagement, the issue may be language or cultural friction. Use these insights to optimize your assistant for global audiences:
- Create language-specific assistants – Set up assistants for key markets (e.g., a “French Assistant” for /fr/ pages). Use analytics to prioritize countries with the most traffic and conversions.
- Adjust conversation starters – Tailor greetings and questions to local communication styles. For example, casual and emoji-rich messages may work in some countries but seem unprofessional in others.
- Optimize chat bubble positioning – Place the chat widget where users expect it. Bottom-right is common globally, but some regions prefer bottom-left. Test placement if engagement is low.
- Add multilingual support strategically – Don’t try to support every language at once. Focus on the top 2–3 countries that drive the majority of international traffic, and expand gradually.
Understanding chat engagement (Chats tab)
To understand why visitors are converting (or leaving), look at the actual conversations in the Chats tab.
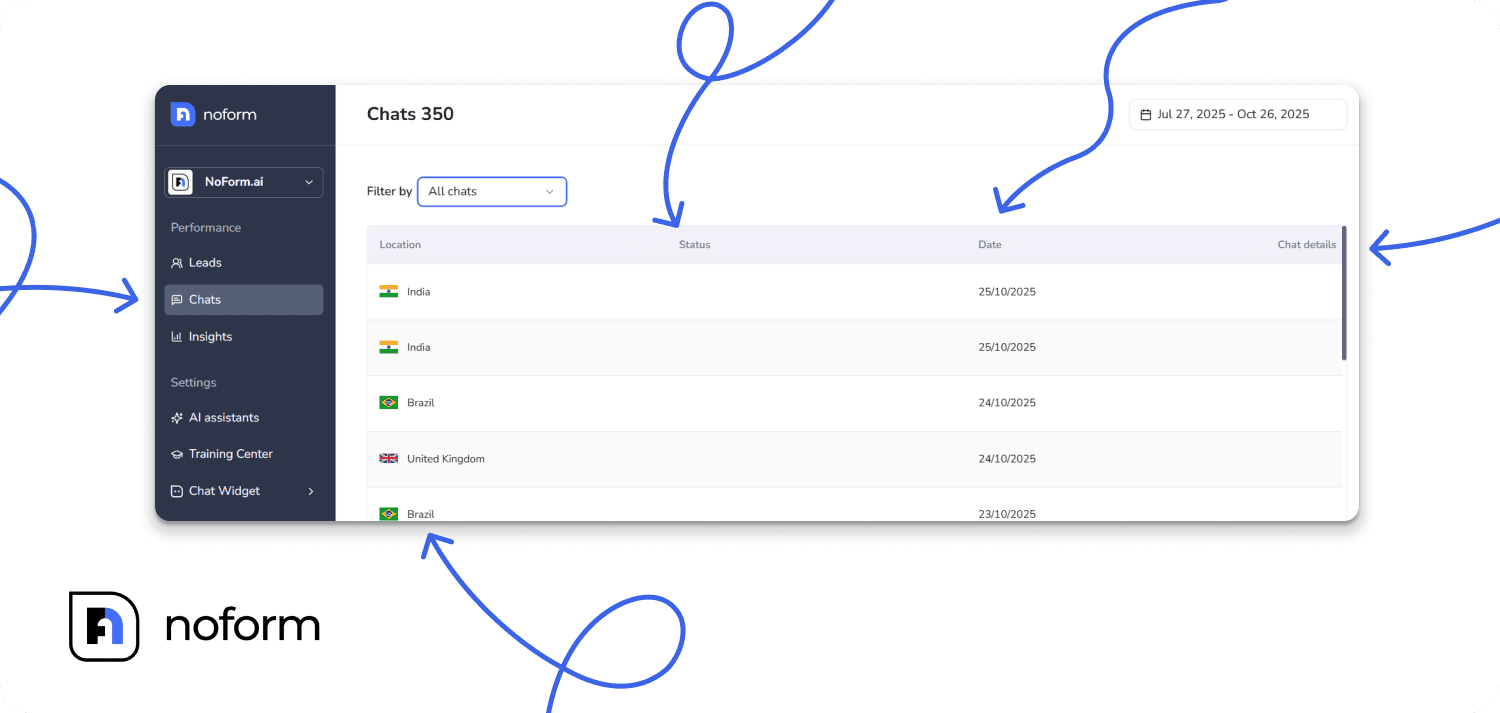
Click “Chats” in the left navigation to see a complete list of every conversation your assistant has had. Each row represents one chat, showing:
- Location: The visitor’s country
- Status: Whether this was just a chat or converted to a lead
- Date: When the conversation happened
- Chat details button: Click to view the full transcript
Filtering options in the Chats tab
When you have hundreds or thousands of chats, filters become essential for finding specific conversations or patterns.
Date range filter
At the top of the page, you can select specific timeframes (e.g., Jan 01 – Mar 31). Use this to:
- Focus on recent conversations
- Compare different time periods
- Analyze performance around particular events or campaigns
Location filter
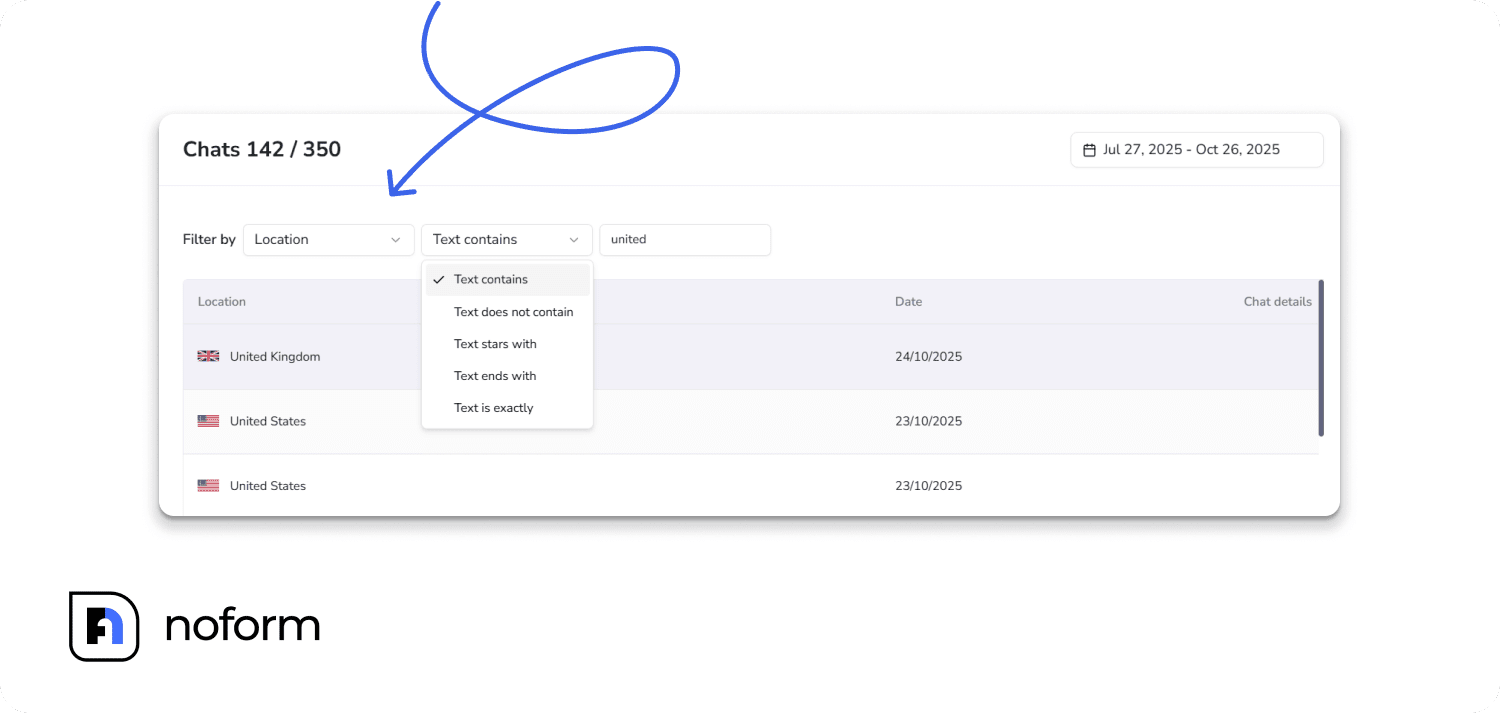
Filter by country to see conversations from specific regions. Options include:
- Text contains: Shows countries with that text anywhere in the name (e.g., “United” shows United States and United Kingdom)
- Text does not contain: Excludes specific countries
- Text starts with: Useful for finding all countries starting with a certain letter
- Text ends with: Rarely used but available
- Is exactly: Pinpoints one specific country (e.g., “France”)
Use case: If your French traffic isn’t converting, filter by “France” to read actual conversations and discover what’s going wrong.
Status filter
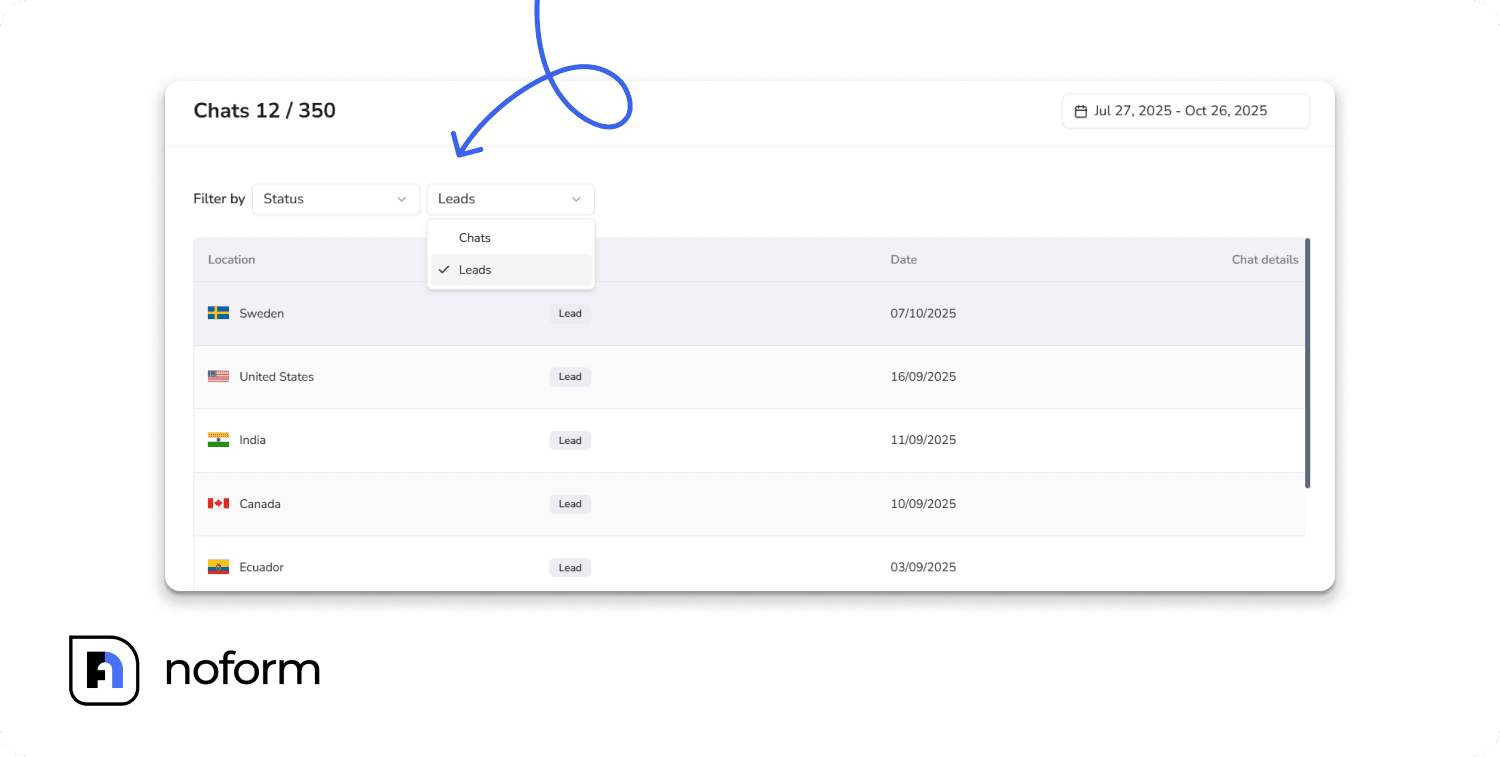
Toggle between “Chats” and “Leads” to:
- Review all conversations for patterns
- Focus only on successful conversions to see what worked
- Analyze non-converting chats to find friction points
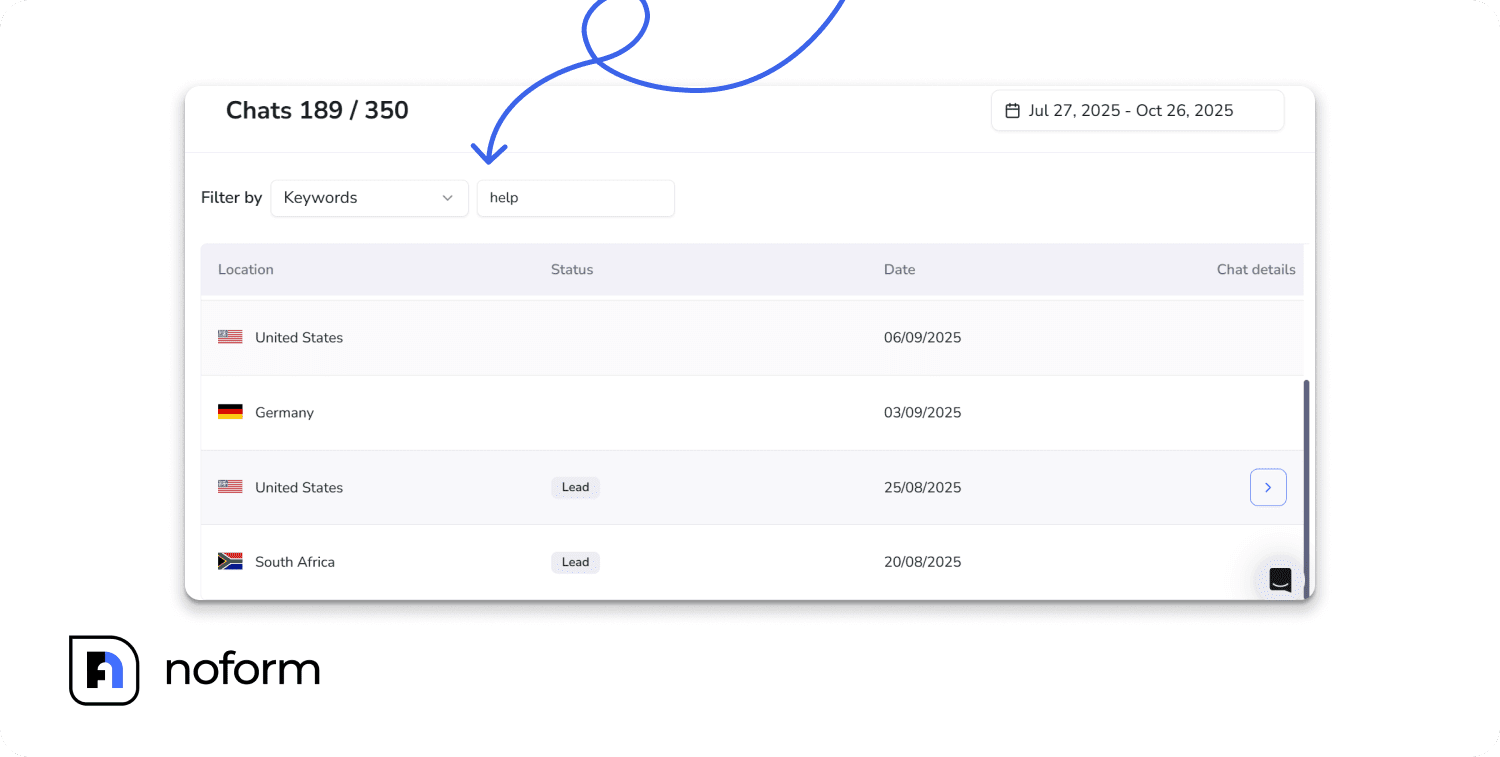
Keywords filter
Search for specific words or phrases that appear in conversations. Examples:
- “pricing” to find all chats about costs
- “refund” to see common objections
- “help” to identify support requests
- Your product names to gauge interest
Chat ID filter
Every conversation has a unique ID. If you need to reference a specific chat (e.g., following up on a lead), you can search by that exact ID.
Deep dive into a chat: The chat details view
Click on any chat to open a detailed view with two tabs: Chat History and Chat Details.
Chat History tab: The transcript
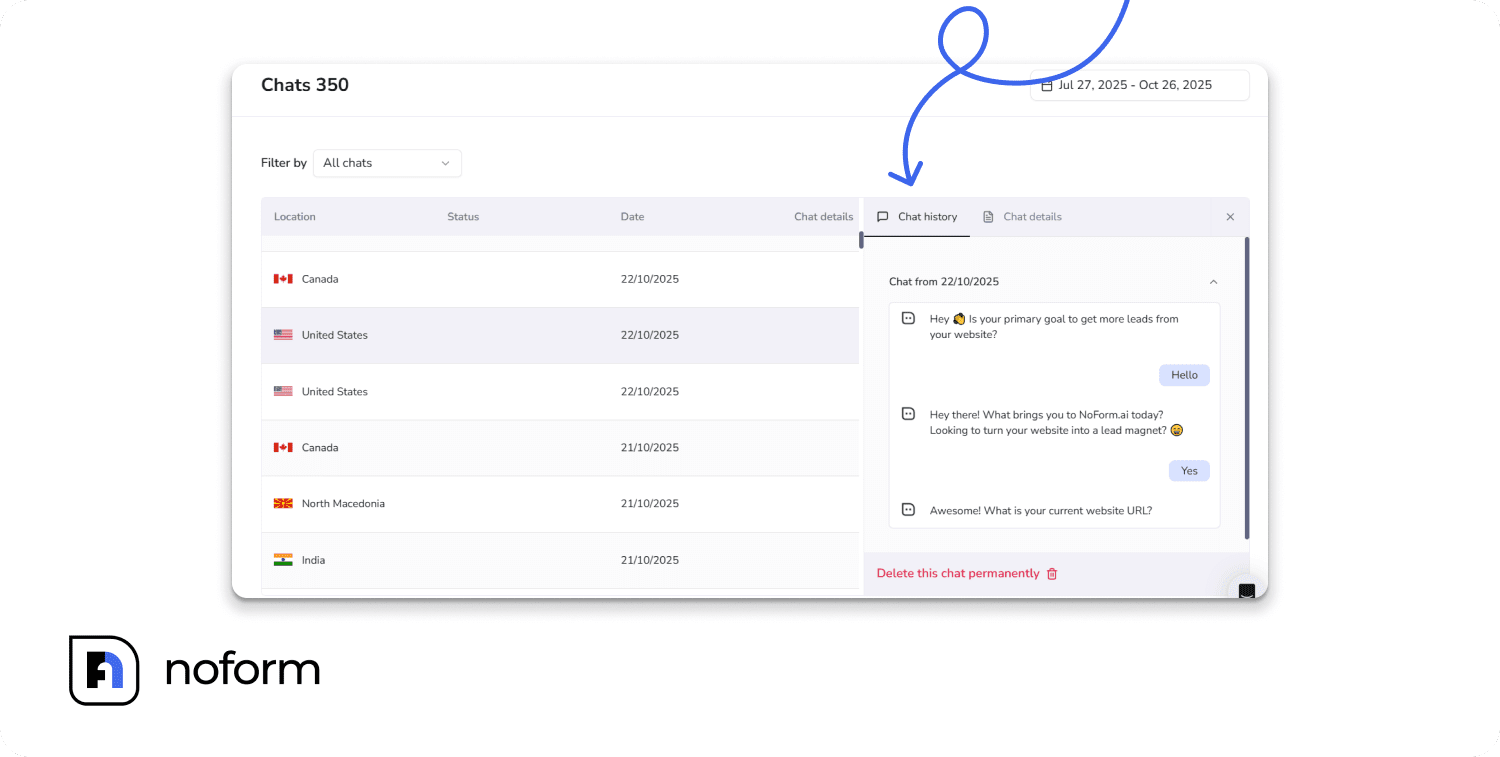
This shows the complete back-and-forth conversation between your assistant and the visitor. You’ll see:
- Every message the visitor sent
- Every response your assistant gave
What to look for:
- Questions the bot answered well
- Questions that confused the bot
- The moment a visitor decided to provide their contact info (or didn’t)
Example insight: You might notice that when visitors ask “How much does this cost?”, your assistant gives a vague answer, and the conversation ends. That’s a training gap—you need to upload clearer pricing information.
Chat Details tab: Context and intelligence
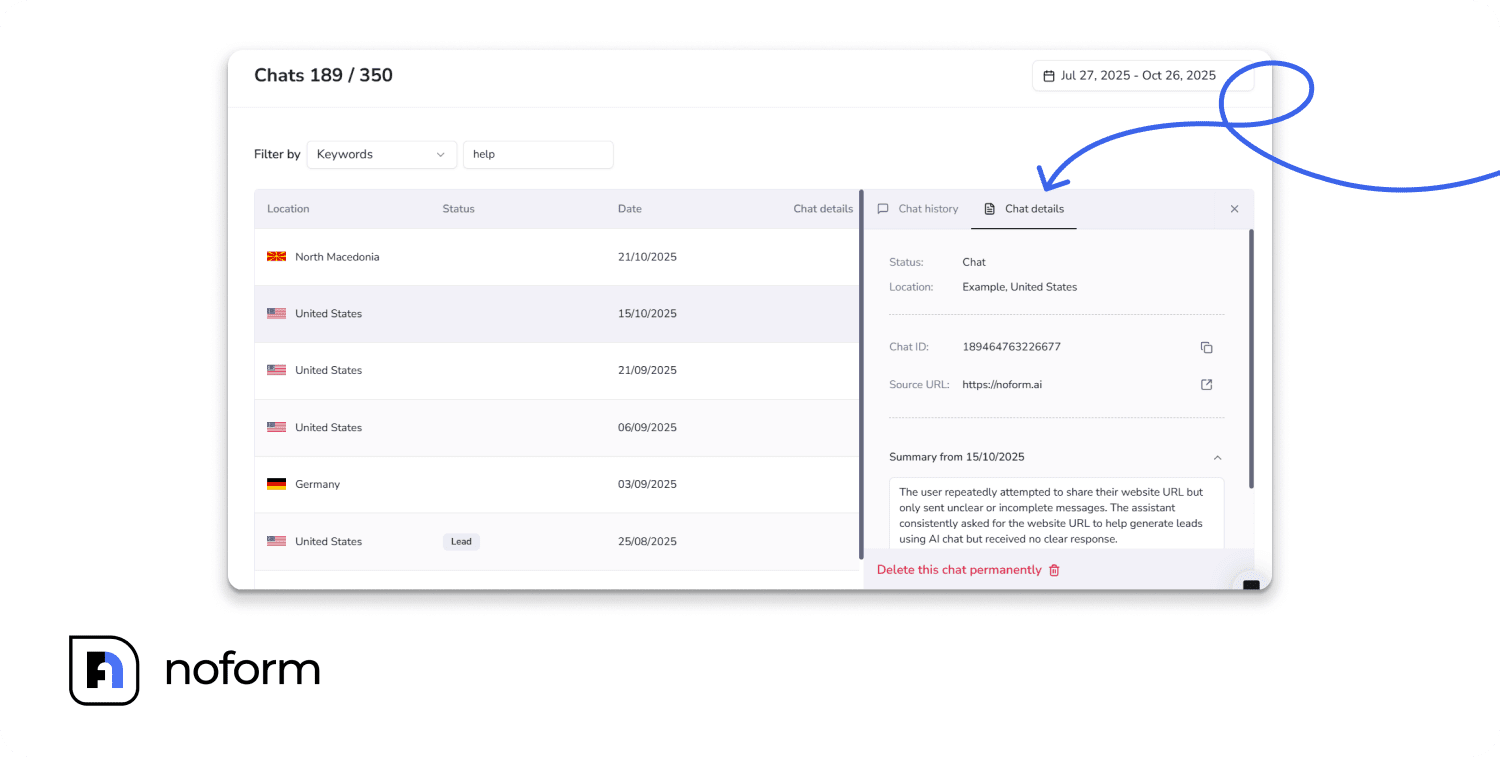
This tab shows metadata about the conversation:
- Status: Whether this was categorized as a “Chat” or a “Lead”
- Location: The visitor’s city and country
- Chat ID: The unique identifier for this conversation
- Source URL: The exact page where the visitor was when they started chatting.
- Converted to Lead: If applicable, this shows the exact timestamp when the visitor became a qualified lead (i.e., when they provided their email or phone).
- AI Summary: NoForm automatically generates a brief summary of the conversation. For long chats with lots of back-and-forth, this summary helps you quickly understand what the visitor wanted without having to read the entire transcript.
Learning from conversations
The real power of the Chats tab isn’t just seeing individual conversations—it’s spotting patterns across many chats.
Identifying common questions and pain points
After reviewing 20-30 chats, you’ll start noticing the same questions:
- “Do you offer a free trial?”
- “What’s your refund policy?”
- “How long does shipping take?”
Add these as conversation starters so visitors can get answers instantly without typing.
Spotting where the AI struggles
If multiple transcripts show the assistant saying “I don’t have specific information about that” or giving generic responses, you’ve found a knowledge gap.
Go to the Training Center and upload the missing document, web page, or FAQ that addresses these questions.
Finding gaps in your training data
Sometimes the bot answers questions, but the answers are outdated or incorrect. This happens when:
- You launched a new product, but haven’t added it to the knowledge base
- Old content is still in the system, contradicting new content
Regularly audit your Training Center. Remove outdated documents and refresh content every 3-6 months.
Recognizing successful conversation patterns
Pay attention to chats that converted to leads. What did the assistant say right before the visitor provided their email? Often, you’ll find phrases like:
- “Would you like me to have someone from our team call you?”
- “Let me get you a custom recommendation. What’s your email?”
Incorporate these successful patterns into your assistant’s instructions and lead qualification settings.
Lead management: Capturing and converting (Leads tab)
The Leads tab is where your potential customers live.
What makes a “qualified lead”
NoForm AI identifies a qualified lead when the assistant successfully captures specific contact information—either an Email or a Phone number.
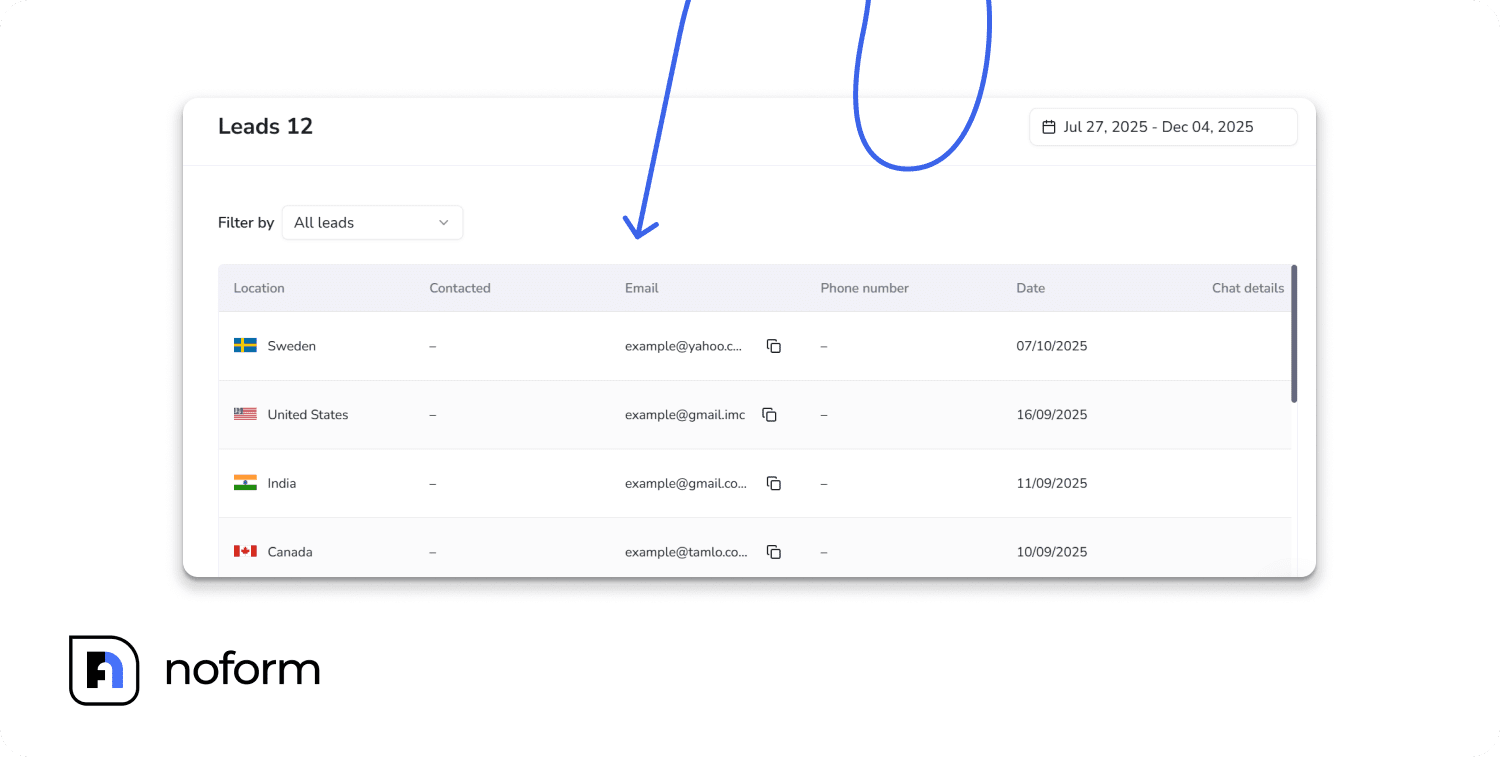
The Leads dashboard
Click “Leads” in the left navigation to see a complete list of leads your assistant has converted. Each row represents one chat, showing:
- Location: The visitor’s country
- Contacted: Shows if your team has followed up
- Email: The email address provided (if any)
- Phone: The phone number provided (if any)
- Date: When the conversation happened
- Chat details button: Click to view more details on the lead
Filtering options in the Leads tab
Just like the Chats tab, you can filter leads to quickly find specific prospects.
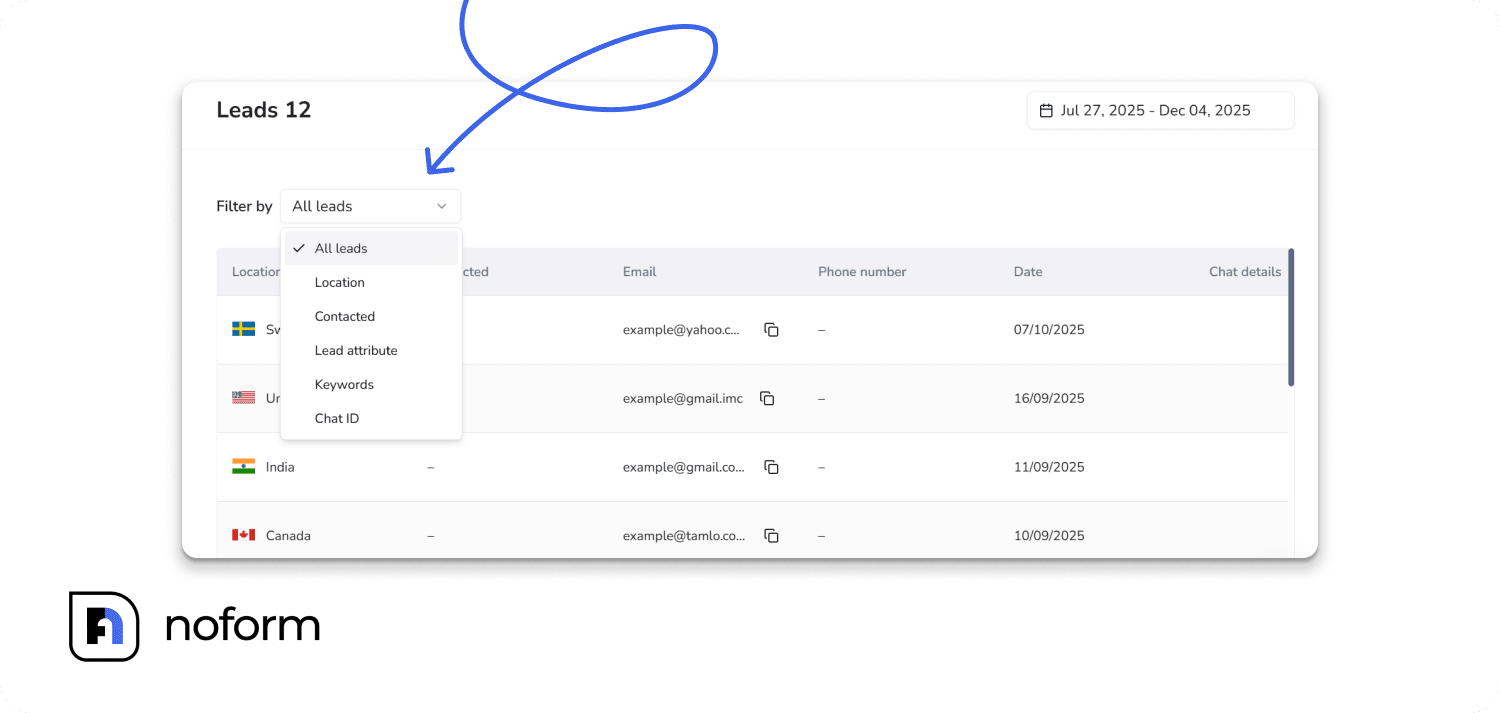
Location filter
Find leads from specific countries or regions using the same filtering options:
- Text contains / does not contain / starts with / ends with / is exactly
Contacted filter
Toggle between:
- Contacted: Leads your team has already followed up with
- Not Contacted: Leads waiting for outreach
Pro tip: Start each day by filtering for “Not Contacted” leads. These are your hottest prospects—they expressed interest recently and haven’t heard from you yet.
Lead attribute filter
Filter by whether leads provided:
- Phone
Use case: If your sales team prefers phone calls, filter for leads with phone numbers. If you run email campaigns, filter for email addresses.
Keywords and Chat ID filters
Same functionality as in the Chats tab—search conversation content or specific IDs to find particular leads.
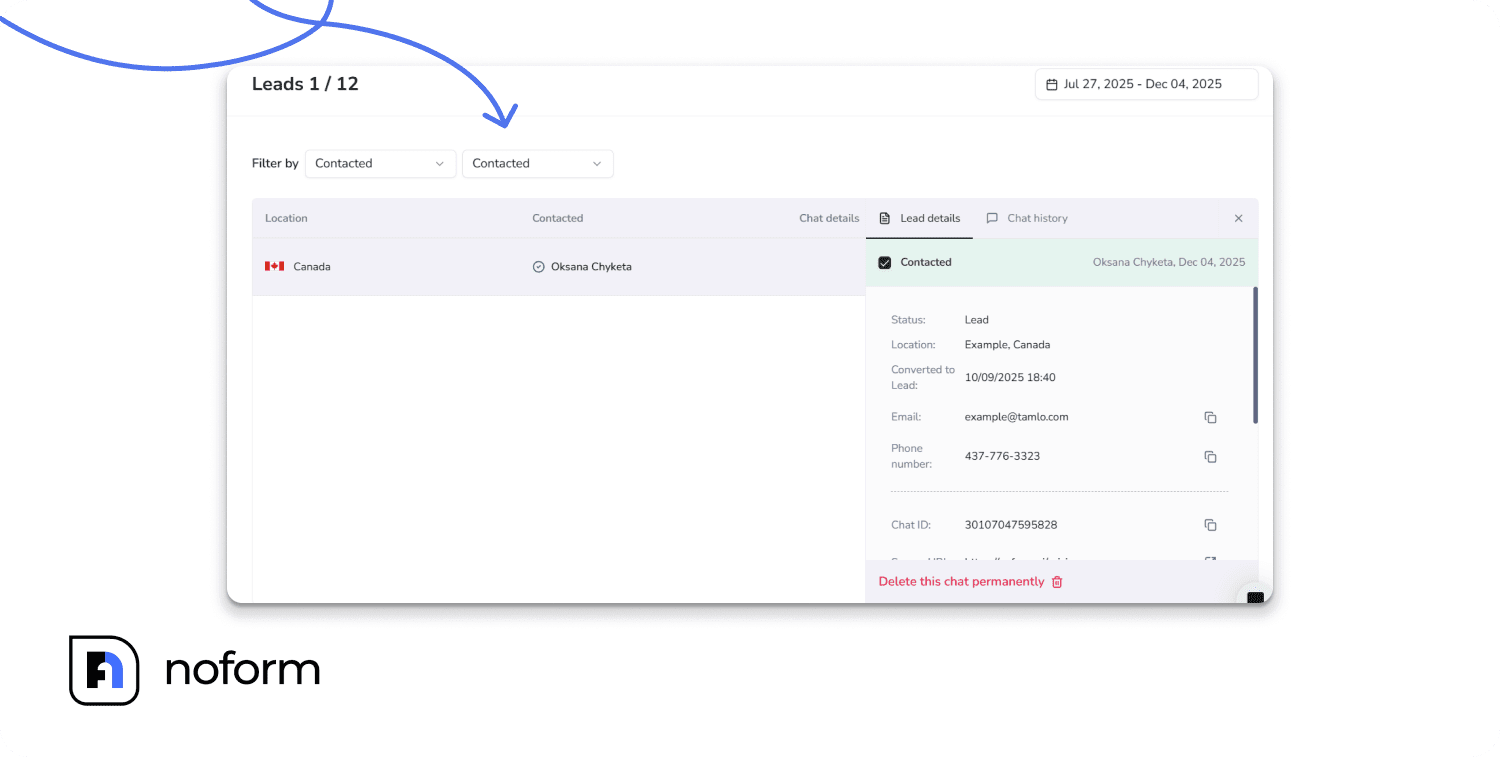
Lead details and intelligence
Click on the Chat details button to open a detailed profile with two tabs: Lead Details and Chat History.
Lead details tab
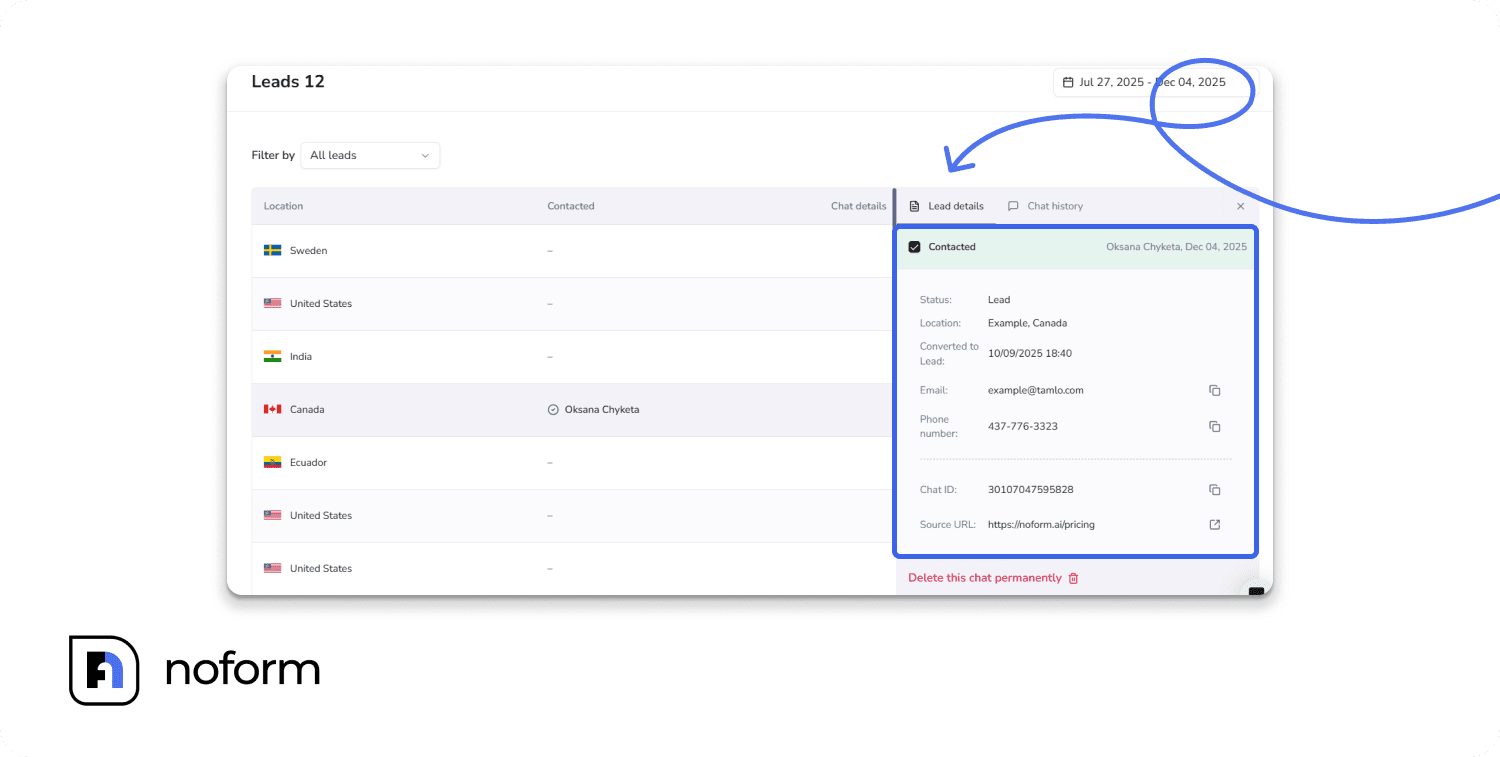
This shows everything you need to follow up effectively:
- Contacted status: A checkbox showing whether your team has followed up. This prevents duplicate follow-ups and helps track sales activity.
- Converted to Lead: The exact date and time the visitor became a lead.
- Contact Info:
- Email address
- Phone number
- Chat ID: The unique identifier for this conversation
- Source URL: The specific page where this lead originated.
- Summary: An AI-generated overview of what the visitor discussed. This gives your sales team context before they reach out, so they can personalize their pitch.
Chat history tab
The complete conversation transcript that led to this lead’s conversion. Your sales team can read precisely what the visitor asked about, what concerns they raised, and what your assistant promised.
Thus, instead of cold-calling with a generic script, your team can say, “Hi [Name], I saw you were asking about our Enterprise plan and had questions about implementation timelines. I’d love to walk you through that…”
Common analytics mistakes to avoid
Even with great tools, it’s easy to misinterpret data or fail to act on insights. Here are the most common pitfalls and how to avoid them.
Mistake #1: Only looking at lead count
Don’t ignore the Chats metric. High chat volume with low leads indicates a process failure that is easy to fix, whereas looking only at low leads might make you think the bot “isn’t working.”
Mistake #2: Not acting on the data
Many businesses review their analytics religiously but never actually change anything based on what they see.
Analytics are useless without action. If you see high traffic from a non-English-speaking country in your Countries table, you must deploy a language-specific assistant.
Mistake #3: Ignoring chat history
Your best optimization insights come from reading actual transcripts. Regular audits reveal exactly what your customers are asking and where your content is lacking.
Set aside 30 minutes a week to review recent chats. You don’t need all of them—reading 15–20 is enough to spot patterns. Focus on:
- Chats that became leads (what worked?)
- Long chats that didn’t convert (where did they stall?)
- Any chat where the bot said it lacked information
Your visitors are already telling you what they need—use their questions as direct feedback. If multiple users ask, “Do you integrate with Salesforce?” and the bot gives a vague reply, update your training materials right away.
Mistake #4: Not tracking changes
You make a change, see improvement, but can’t remember what you actually did.
Or worse—you make changes and performance declines, but you don’t know which change caused the problem.
Document what you change and when:
|
Date |
Change Made |
Hypothesis |
Result (2 weeks later) |
|
3/1 |
Updated pricing page welcome message |
More specific message will increase engagement |
Visitor-to-Chat rose from 8% to 11% |
Over time, this becomes your playbook—revealing what consistently boosts engagement, what hurts conversion, and what patterns matter for your audience. It’s invaluable when team members rotate or when you want to replicate success across other pages.
Conclusion
Chatbot analytics are not just numbers; they are the roadmap to a better customer experience and higher revenue. By leveraging the Insights, Chats, and Leads tabs in NoForm AI, you can move beyond simple automation and create a data-driven strategy that consistently captures more qualified leads.
Ready to optimize? Log in to your NoForm AI dashboard, navigate to the Insights tab, and identify one area to improve this week. Small changes compound into major results.
Frequently Asked Questions (FAQ)
What is chatbot analytics?
Chatbot analytics is the systematic tracking and analysis of interactions between an AI assistant and website visitors. It goes beyond simple page views to measure engagement metrics, such as how many visitors open the chat, how many conversations turn into qualified leads, and where the AI fails to answer questions. This data helps businesses optimize their training materials and improve ROI.
How do I track leads in NoForm AI?
You can track leads in NoForm AI using the dedicated Leads Tab in the dashboard. The system automatically categorizes a user as a ‘Lead’ once the AI successfully captures their email address or phone number. This tab allows you to view contact details, read the specific conversation history that led to the conversion, and toggle the status to ‘Contacted’ once your sales team has followed up.
What is a good chatbot conversion rate?
According to NoForm AI benchmarks, a ‘good’ Visitor to Chat conversion rate falls between 5% and 15%. For Chat to Lead conversion (visitors who talk to the bot and then provide contact info), a healthy benchmark is between 3% and 10%. Rates lower than these suggest visibility issues or that the bot is asking for contact details too abruptly.
How can I tell why my chatbot isn’t converting leads?
To diagnose low conversion rates, you should use the Chats Tab to review individual conversation transcripts. Look for patterns where users drop off—common issues include asking for contact information too early in the flow or the bot failing to answer specific product questions. If you see high chat volume but low lead capture, it is often a “qualification problem” rather than an engagement problem.
Does NoForm AI show where my visitors are located?
Yes, the Insights Tab includes a ‘Countries’ table that breaks down performance geographically. It displays Visitors, Chats, and Leads per country. This data is critical for deciding when to launch multilingual assistants; for example, if you see high traffic but low engagement from France, it may indicate the need for a French-language assistant.
What is the difference between the ‘Chats’ and ‘Leads’ tabs?
The Chats Tab acts as a complete archive of every interaction your bot has, regardless of the outcome. The Leads Tab is a filtered view that only contains high-value conversations where the visitor explicitly provided contact information (email or phone). Sales teams should prioritize the Leads tab for outreach, while product teams should use the Chats tab to improve the AI’s training.